Bodies on the Line: Quantifying how defenders affect chances.

From blogs to the BBC, the concept of ‘expected goals’ has entered the mainstream media's lexicon. It has caught on because it’s a useful concept; it’s a useful concept because football is a low-scoring game. Chance (or luck) can be the difference between victory and defeat, a good day or an off-day. Expected goals, however, measures what would have happened on an average day.
It’s a simple quantity to measure. Shots are assigned a number between the 0 or 1: the proportion of similar shots (from the same position, for example) that have resulted in a goal. I’ll refer to this as ‘chance quality’. You then add up the chance quality for every shot taken by a team in a match to calculate the number of goals that you would have ‘expected’ them to score that day[1].
One problem with typical measures of chance quality is that they tend to ignore the other team. How many of their defenders were between the shot-taker and the goal? How effectively were they denying him the time and space to take a clean shot? There is a huge difference between rolling the ball towards an undefended net, and fighting off four defenders while stretching to get a toenail on a cross.
Fortunately, thanks to Stratagem Technologies, we can now rectify the situation. Their analysts encode at least two pieces of important defensive information in their ‘key chances’ dataset: the number of defending players between the ball and the goal as the shot was taken and an assessment of the pressure they exerted on the attacking player as he took a shot.
In this post I’m going to investigate how chance quality is affected by the location and actions of the opposing defenders. I’ll do this in two stages: first, I’ll build a basic model in which the probability of a goal is determined solely by shot position and shot type (header, penalty, free kick, etc). I’ll then extend this model to incorporate Stratagem's defence metrics, demonstrating quantitatively how the configuration and actions of the defending team influence the probability of a goal.
The Basic Model
Stratagem collect a huge amount of data for each match. Most notably for this analysis, they provide[2]:
1) Shot location;
1) Shot location;
2) Type of shot (free kick, penalty, own goal, open play);
3) Part of body (left foot, right foot, header);
4) Number of defenders between the shot location and goal;
5) Defensive pressure (on a scale between 0-5);
I will focus on shots that arise from open-play, ignoring free kicks, penalties and own goals. The data is currently only available for the 2016/17 season; the final dataset consists of just under 7600 open-play chances.
For the basic model I used logistic regression to determine the probability of a shot producing a goal (chance quality) given the distance and angle to the goal line (as indicated in Figure 1). Equations and regression results are given in Appendix 1 at the end of this post; as you’d expect, the coefficients for position and angle are both highly significant for both headed and non-headed chances.
Figure 1 shows the results for non-headed shots on goal. The coloured ‘zones’ indicate chance quality as a function of distance and angle. For example, shots taken within zone 1 (the cyan region) have a 5-10% chance of producing a goal; those within zone 2 have a 10-20% chance; zone 3, a 20-30% chance; and so on. At least half the shots within the innermost zone (zone 6 – the red region) are expected to produce a goal.
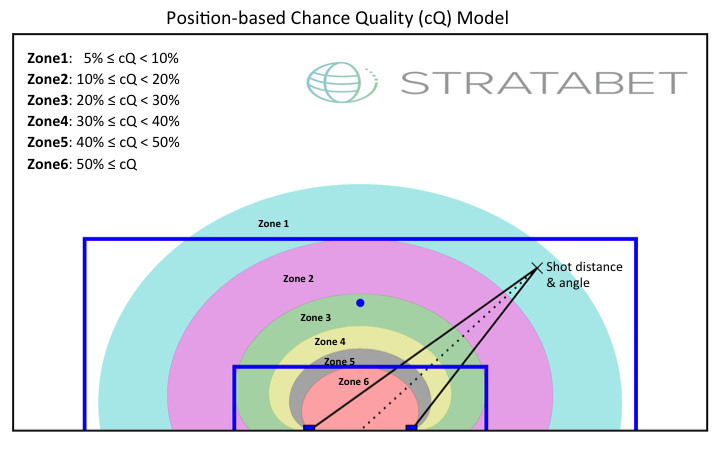 |
| Figure 1: Chance Quality in the basic model. The coloured zones indicate the probability of a (non-headed, open play) shot producing a goal as a function of distance and angle to goal. Shots taken in the outermost zone (zone 1: cyan) have a 5-10% probability of producing a goal; those taken within the innermost zone (red) have at least a 50% chance. |
This is a fairly standard model for chance quality, however it tells us nothing about the influence of the defending team, just the average probability of scoring from a given position. The next step is to investigate how chance quality varies as we incorporate Stratagem’s defensive metrics.
Incorporating Defense Metrics
As mentioned above, Stratagem provide two indicators; ‘numDefPlayers’: the number of defensive players (including the goalkeeper) in a direct line from the shot position to the goal, and ‘defPressure’: the defensive pressure exerted on the shot-taker, rated on a scale between 0-5. Stratagem describe their pressure scoring system in the following way:

But what does the new information imply in a practical sense? Loosely speaking, every three extra intervening defenders halves the probability of a goal. An unopposed (non-headed) shot from twelve yards in open play will result in a goal for 42% of shots (2 in 5); placing three defenders between the goal and shot-taker reduces this to 24%. Increasing defensive pressure from none to high pressure (a score of 4 in Stratagem's system) has approximately the same impact.
Figure 2 demonstrates graphically how chance quality is dependent on the defensive indicators. It shows four scenarios: top-left, shots taken under light defensive pressure and only one intervening defensive player (normally the goalkeeper); top-right, low defensive pressure but four intervening defensive players; bottom-left, high pressure with two intervening defensive players; and bottom-right, high pressure and four intervening defenders. In each case I provide an example chance from the 2016/17 season; all four shots were selected to be in roughly the same position. The zones indicate chance quality and are coloured in the same way as in Figure 1: 5-10% (cyan), 10-20% (magenta), 20-30% green, 30-40% yellow and >=50% (red).
 |
| Figure 2: The impact of defence on chance quality. Each panel demonstrates how the probability of a shot producing a goal is dependent on the number of intervening defenders and the degree of physical pressure exerted on the shot-taker. The coloured zones indicate the probability of a (non-headed, open play) shot producing a goal as a function of distance and angle to goal (cyan: 5-10%, magenta: 10-20%, green 20-30%, yellow: 30-40%, grey: 40-50% and red: >50%). |
The four scenarios clearly demonstrate how the probability of a goal is dependent on the defence. When a player has a clear, unimpeded sight of goal (top-left in Figure 2) the probability of scoring from any reasonable distance increases significantly. Zones 1 and 2 (cyan and magenta contours) extend out well beyond the penalty area, and zone 6 (the innermost zone, indicating a >50% chance of a goal) extends beyond the six-yard box. Shots near the penalty spot – such as Benik Afobe’s chance for Bournemouth in the 61st minute against Southampton in April – have a one-in-three chance of producing a goal, on average.
At the other extreme (bottom right), a highly pressurized and obstructed shot on goal, chance quality is significantly reduced. Shots around the penalty spot – such as Nacer Chadli’s shot in the 70th minute of West Brom’s match at Liverpool last season – have a 1 in 10 chance of producing a goal: three times lower than the unimpeded case. Zone 1 (the outermost zone) does not extend beyond the penalty area, and the probability of scoring anywhere outside the six-yard box is less than 25%. This example clearly demonstrates the difficulty of playing against a packed defense.
Summary
In this post I’ve demonstrated that the information recorded by Stratagem on the positions and actions of the defending team is important for assessing chance quality. I’ve constructed a chance quality model that incorporates both the number of intervening defenders and the amount of pressure being applied to the attacking player, demonstrating that it out-performs models based on shot position and type alone. The availability of this data is clearly of huge benefit to the analytics community.
The results quantify the difficulty of scoring against a packed defense. The probability of scoring a shot from outside a crowded penalty area is less than 5%, essentially wasting possession. A well-organised, ultra-defensive team can reduce the probability of scoring from outside the six-yard box to less than 20%, or one in five. In that situation, the ability to maneuver defenders out of position is clearly very important.
It’s worth pointing out that, over the course of the 2016/17 season, the variance between defensive situations averages out and so the expected goals scored or conceded for each EPL team is not significantly different relative to position-only models. The largest change is Liverpool’s expected goals against, which increases from 0.96 goals per game in the basic model to 1.03: that’s 36 to 39 goals in total over the season (they actually conceded 42). This implies that Liverpool’s defence allowed their opponents slightly better chances than a shot position-only model would suggest.
Thanks to David Shaw for comments.
This article was written with the aid of StrataData, which is property of Stratagem Technologies. StrataData powers the StrataBet Sports Trading Platform, in addition to StrataTips.
------------------------------------------------
[1] It’s important to note that most measures are independent of the identity of the player taking the shot. You need a dataset comprising of thousands of shots to properly measure chance quality over all positions and situations, therefore you must aggregate shots from many different players. The chance quality of a shot is more correctly the goal probability for the ‘average player’ in your dataset.
[2] Stratagem also collect data on assists, shot quality and make a more subjective assessment of chance quality.
APPENDIX 1: Model regression results
The logistic model for chance quality is defined as:
Chance Quality = 1/(1+exp(-y) )
where, in the basic model,
y= β0+β1*distance+ β2*angle
and in the extended model,
y= β0+β1*distance+ β2*angle+ β3*pressure+β4*nDef.
nDef is the number of defenders between shot and goal, and pressure is Stratagem's defensive pressure rating for the shot. The beta coefficients were determined using logistic regression, performed separately for headed and non-headed chances (open play only: penalties, free kicks and own goals were excluded). Distance is in Stratagem's co-ordinate system (1 unit = 0.267 yards); angles are in degrees. The resulting coefficients are shown in the table below. Note that both pressure and nDef contribute to the improvement in the loglikelhood of the extended model.


Comments
Post a Comment